|
|
Post by swanarcadian on Apr 30, 2018 22:52:54 GMT
Bermondsey
|
|
|
|
Post by rightleaning on Aug 5, 2018 8:32:50 GMT
Bermondsey No 1
1900 6 2,134 39.8% 849
Burton A. Progressive 452 53.2%
Ecroyd W. Progressive 441 51.9%
Pomeroy E. Progressive 433 51.0%
McCarthy D. Progressive 424 49.9%
Marner G. Progressive 394 46.4%
Roche P. Progressive 386 45.4%
Clark A. Moderate 369 43.4%
Driver W. Moderate 368 43.3%
Davies J. Moderate 366 43.1%
Bryant J. Moderate 356 41.9%
Blagg T. Moderate 348 41.0%
Truman F. Moderate 332 39.1%
1903 6 2,105 48.5% 1,021
Fogden J. Moderate 541 53.0%
McCarthy D. Moderate 496 48.6%
Clark A. Moderate 472 46.2%
Brenner G. Moderate 471 46.1%
Davies J. Moderate 464 45.4%
Roche P. Moderate 442 43.3%
Burton A. Progressive 399 39.1%
Pomeroy E. Progressive 387 37.9%
Cook W. Progressive 353 34.6%
Edwards J. Progressive 345 33.8%
Hudson J. Progressive 343 33.6%
Ellis E. Progressive 310 30.4%
Taylor T. Independent 237 23.2%
1906 6 2,442 43.6% 1,065
Fogden J. Municipal Reform 481 45.2%
Hitchcock J. Municipal Reform 441 41.4%
Clark A. Municipal Reform 440 41.3%
Brenner G. Municipal Reform 432 40.6%
Stickford E. Municipal Reform 391 36.7%
Lillywhite J. Municipal Reform 384 36.1%
Ecroyd W. Progressive 339 31.8%
Burton A. Progressive 332 31.2%
Pomeroy T. Progressive 324 30.4%
Jefferys W. Progressive 317 29.8%
Callaghan D. Cath 297 27.9%
Cook W. Progressive 297 27.9%
Marner G. Progressive 295 27.7%
Taylor T. Cath 264 24.8%
Pearson J. Cath 236 22.2%
1909 6 2,165 43.8% 948
Fogden J. Municipal Reform 515 54.3%
Clark A. Municipal Reform 491 51.8%
Davies J. Municipal Reform 490 51.7%
Brenner G. Municipal Reform 485 51.1%
Strickland E. Municipal Reform 461 48.6%
Franken L. Municipal Reform 453 47.8%
Connor J. Progressive 436 46.0%
Hall G. Progressive 411 43.3%
Peckham J. Progressive 401 42.3%
Lordon W. Progressive 398 42.0%
Garfitt C. Progressive 397 41.9%
Speer J. Progressive 387 40.8%
1912 6 1,937 42.9% 831
Taylor T. Progressive 417 50.2%
Fodgen J. Municipal Reform 406 48.9%
Burton A. Progressive 402 48.4%
Connor J. Progressive 393 47.3%
Barrett T. Progressive 386 46.5%
Coghlan J. Progressive 386 46.5%
Gilham G. Progressive 381 45.8%
Clark A. Municipal Reform 379 45.6%
Strickland E. Municipal Reform 363 43.7%
Hunt H. Municipal Reform 359 43.2%
Anderson H. Municipal Reform 356 42.8%
Franken L. Municipal Reform 347 41.8%
1919 6 4,463 22.4% 1,000
Barrett T. Labour 339 33.9%
Taylor T. Progressive 332 33.2%
Stephens J. Labour 331 33.1%
Broughton A. Labour 326 32.6%
Bamford A. Labour 322 32.2%
Gamble M. Labour 295 29.5%
Gilham G. Progressive 276 27.6%
Rowe G. Progressive 263 26.3%
Bryan D. Progressive 261 26.1%
Clark A. Municipal Reform 246 24.6%
Honeyman G. Progressive 242 24.2%
Dukes J. Progressive 239 23.9%
Garnar J. Municipal Reform 193 19.3%
Gough W. Municipal Reform 184 18.4%
Williams J. Municipal Reform 178 17.8%
Shepherd H. Municipal Reform 174 17.4%
Russell J. Municipal Reform 169 16.9%
Lordan W. Independent 131 13.1%
Bates A. Independent 120 12.0%
Harwood G. Independent 98 9.8%
1922 6 4,604 33.7% 1,552
Kedward R. Progressive 776 50.0%
Taylor T. Progressive 682 44.0%
Clarke A. Progressive 616 39.7%
Govel J. Progressive 580 37.4%
Hatcher W. Progressive 562 36.2%
Stephens J. Labour 547 35.3%
Jackson T. Progressive 546 35.2%
Mahoney B. Labour 514 33.1%
Sweeney T. Labour 493 31.8%
Pitts S. Labour 465 30.0%
Broughton A. Labour 460 29.6%
Howard W. Labour 449 28.9%
Gale C. P.R 317 20.4%
Rowe G. P.R 294 18.9%
Jagger H. P.R 264 17.0%
Hunt H. P.R 258 16.6%
Ibbett L. P.R 215 13.9%
1925 6 4,734 35.7% 1,690
Hall J. Labour 1,072 63.4%
Anstey B. Labour 1,052 62.2%
Horwood G. Labour 1,045 61.8%
Kipps F. Labour 1,022 60.5%
Heather F. Labour 1,011 59.8%
Maskell J. Labour 997 59.0%
Hatcher W. E.A 673 39.8%
Clark A. E.A 635 37.6%
Rowe G. E.A 591 35.0%
Marking R. E.A 546 32.3%
Levy S. E.A 543 32.1%
Snook F. E.A 537 31.8%
1928 6 4,616 28.6% 1,320
Franklin G. Labour 881 66.7%
Kipps F. Labour 876 66.4%
Benfield F. Labour 874 66.2%
Horwood G. Labour 873 66.1%
Homewood M. Labour 872 66.1%
Witham M. Labour 796 60.3%
Barnett S. E.A 411 31.1%
Mathias H. E.A 404 30.6%
Rowe G. E.A 377 28.6%
Shearring M. E.A 353 26.7%
Russell J. E.A 350 26.5%
Pearcy C. E.A 345 26.1%
Taylor T. Independent 64 4.8%
1931 6 5,070 27.1% 1,374
Donovan J. Labour 790 57.5%
Coyle E. Labour 785 57.1%
Horwood G. Labour 776 56.5%
Franklin L. Labour 759 55.2%
Franklin G. Labour 745 54.2%
McAleer M. Labour 733 53.3%
Dowsett C. E.A 473 34.4%
Bolt S. E.A 429 31.2%
Martin W. E.A 423 30.8%
Thornton L. E.A 411 29.9%
Clark J. E.A 407 29.6%
Upchurch E. E.A 394 28.7%
Clark A. Progressive 370 26.9%
1934 6 4,628 27.5% 1,273
Cragie W. Labour 1,070 84.1%
Horwood G. Labour 1,067 83.8%
Ayling T. Labour 1,065 83.7%
Doyle E. Labour 1,036 81.4%
Nix E. Labour 1,030 80.9%
Laker R. Labour 1,007 79.1%
Ball F. Municipal Reform 216 17.0%
Caney M. Municipal Reform 215 16.9%
Hart J. Municipal Reform 186 14.6%
Drewitt E. Municipal Reform 183 14.4%
Smith R. Municipal Reform 172 13.5%
Parkes E. Municipal Reform 171 13.4%
Browne J. Communist 168 13.2%
Merrells H. Communist 162 12.7%
Brown W. Communist 150 11.8%
1937 6 4,322 37.7% 1,629
Cragie W. Labour 1,149 70.5%
Clark W. Labour 1,143 70.1%
Douglas J. Labour 1,118 68.6%
Goodwin R. Labour 1,116 68.5%
Green G. Labour 1,072 65.8%
Laker R. Labour 1,023 62.8%
Horwood G. ILC 499 30.6%
Wright J. ILC 404 24.8%
Rowe G. Conservative 189 11.6%
Sharp E. Conservative 183 11.2%
Reed R. Conservative 178 10.9%
Sandley G. Conservative 172 10.6%
1945 6 4,353 23.1% 1,006
Goodwin R. Labour 882 87.7%
Gardner A. Labour 876 87.1%
Hendy T. Labour 864 85.9%
Laker E. Labour 863 85.8%
Sullivan J. Labour 859 85.4%
Samuels C. Labour 835 83.0%
Purnell J. IMP 111 11.0%
Dearsley F. IMP 98 9.7%
Bridger G. IMP 96 9.5%
1949 6 4,683 0.0% 0
Eagle T. Labour 0 0.0%
Gardner W. Labour 0 0.0%
Hendy T. Labour 0 0.0%
Meadows A. Labour 0 0.0%
Samuel C. Labour 0 0.0%
Walker A. Labour 0 0.0%
|
|
|
|
Post by rightleaning on Aug 5, 2018 8:38:08 GMT
Bermondsey No 2
1900 6 2,225 44.5% 990
Widdows J. Progressive 537 54.2%
Bevington S. Moderate 535 54.0%
Mulqueen J. Progressive 531 53.6%
McCarthy M. Progressive 504 50.9%
Cook W. Progressive 456 46.1%
Grace G. Moderate 452 45.7%
Garnar J. Moderate 449 45.3%
Walker H. Progressive 447 45.1%
Peeke G. Moderate 446 45.0%
Paice J. Progressive 444 44.8%
Shepherd G. Moderate 433 43.7%
Parkinson W. Moderate 363 36.7%
1903 6 2,103 49.6% 1,043
Shepherd G. Moderate 502 48.1%
Widdows J. Progressive 484 46.4%
Anderson J. Moderate 470 45.1%
Garnar J. Moderate 464 44.5%
Hitchcock J. Moderate 443 42.5%
Peeke G. Moderate 439 42.1%
Percy E. Moderate 391 37.5%
Harris J. Progressive 365 35.0%
Edwards G. Progressive 359 34.4%
Chambers H. Progressive 347 33.3%
Rodgers H. Progressive 346 33.2%
Trott H. Progressive 326 31.3%
Wood E. Independent 321 30.8%
1906 6 2,842 44.8% 1,273
Shepherd G. Municipal Reform 587 46.1%
Brine F. Municipal Reform 539 42.3%
Anderson J. Municipal Reform 530 41.6%
Garner J. Municipal Reform 523 41.1%
Widdows J. Progressive 520 40.8%
Peeke G. Municipal Reform 501 39.3%
Salter A. Progressive 498 39.1%
Vickars G. Municipal Reform 475 37.3%
Manser J. Progressive 456 35.8%
McCarthy M. Progressive 438 34.4%
Ammon C. Progressive 403 31.7%
Partridge G. Progressive 380 29.8%
O'Reilly J. Cath 189 14.8%
Coghlan J. Cath 185 14.5%
Sullivan J. Cath 180 14.1%
Peckham J. Cath 176 13.8%
Lawson R. Cath 165 13.0%
Lonergan S. Cath 161 12.6%
1909 6 2,603 53.6% 1,395
Ecroyd W. Progressive 806 57.8%
Wallsgrove G. Progressive 774 55.5%
Kirby J. Progressive 750 53.8%
Bevington R. Municipal Reform 604 43.3%
Shepherd G. Municipal Reform 548 39.3%
Anderson J. Municipal Reform 533 38.2%
Garnr J. Municipal Reform 525 37.6%
Anderson H. Municipal Reform 517 37.1%
Holton H. Municipal Reform 479 34.3%
Briggs T. Labour 399 28.6%
Fletcher H. Labour 399 28.6%
Olivier B. Labour 390 28.0%
1912 6 2,179 49.5% 1,079
Wallsgrove G. Progressive 590 54.7%
Shearring W. Progressive 540 50.1%
Wood E. Progressive 539 50.0%
Kirby J. Progressive 534 49.5%
Sweeney D. Progressive 522 48.4%
Embleton B. Progressive 511 47.4%
Paterson A. Independent 511 47.4%
Storey C. Municipal Reform 402 37.3%
Holton H. Municipal Reform 395 36.6%
Veale-Williams J. Municipal Reform 390 36.2%
Brent F. Municipal Reform 386 35.8%
Williamson W. Municipal Reform 368 34.1%
1919 6 5,145 23.9% 1,230
Wallsgrove G. Progressive 656 53.3%
Wood E. Progressive 617 50.2%
Coghlan J. Progressive 542 44.1%
Holland L. Progressive 542 44.1%
Moore J. Progressive 520 42.3%
Lyon J. Progressive 496 40.3%
Geoghegan P. Independent 408 33.2%
Sweeney D. Independent 406 33.0%
Shearring W. Independent 403 32.8%
Connor J. Independent 400 32.5%
Kirby J. Independent 359 29.2%
Hayes J. Independent 348 28.3%
Patrick A. Municipal Reform 240 19.5%
Hembrow R. Municipal Reform 137 11.1%
Joy C. Municipal Reform 125 10.2%
1922 6 5,337 31.4% 1,676
Sweeney D. Labour 776 46.3%
Ince C. Labour 725 43.3%
Tingle G. Labour 680 40.6%
George E. Labour 651 38.8%
Virgo A. Labour 650 38.8%
Brown F. Labour 644 38.4%
Wallsgrove G. Progressive 622 37.1%
Wood E. Progressive 568 33.9%
Whitland R. Progressive 512 30.6%
Kimber W. Progressive 503 30.0%
Sharp A. Progressive 461 27.5%
Collins G. Progressive 443 26.4%
Collins C. P.R 377 22.5%
McDonnell J. P.R 362 21.6%
Holton H. P.R 342 20.4%
Selby E. P.R 330 19.7%
Russell J. P.R 325 19.4%
Prosser H. P.R 313 18.7%
1925 6 5,514 40.4% 2,228
Ecroyd E. Labour 1,435 64.4%
Geoghegan P. Labour 1,354 60.8%
Ince C. Labour 1,332 59.8%
George E. Labour 1,330 59.7%
Tingle G. Labour 1,278 57.4%
Virgo A. Labour 1,258 56.5%
Coughtrey W. E.A 876 39.3%
Collins G. E.A 847 38.0%
Barnett S. E.A 794 35.6%
Mason A. E.A 790 35.5%
Selby E. E.A 788 35.4%
Nicklin A. E.A 739 33.2%
1928 6 5,470 30.5% 1,668
George E. Labour 1,012 60.7%
Glasson E. Labour 1,002 60.1%
Tingle G. Labour 998 59.8%
Stean G. Labour 987 59.2%
Purser J. Labour 979 58.7%
Smith P. Labour 974 58.4%
Jefferys A. E.A 633 37.9%
Harradine J. E.A 598 35.8%
Selby W. E.A 584 35.0%
Robertson J. E.A 578 34.6%
Cox H. E.A 576 34.5%
Levy S. E.A 569 34.1%
1931 6 5,862 39.2% 2,298
Tingle G. Labour 1,347 58.6%
George E. Labour 1,315 57.2%
Groves K. Labour 1,297 56.4%
Stean G. Labour 1,290 56.1%
Wright J. Labour 1,277 55.6%
Smith P. Labour 1,274 55.4%
Boutcher T. E.A 926 40.3%
Pearcy C. E.A 924 40.2%
Bennett F. E.A 913 39.7%
Sleep H. E.A 900 39.2%
Rouse E. E.A 887 38.6%
Russell J. E.A 868 37.8%
1934 6 5,566 35.4% 1,970
Tingle G. Labour 1,596 81.0%
Stean G. Labour 1,572 79.8%
Smith P. Labour 1,568 79.6%
Wright J. Labour 1,567 79.5%
McKay W. Labour 1,516 76.9%
Groves K. Labour 1,496 75.9%
Pearcy C. Municipal Reform 387 19.6%
Nicklin A. Municipal Reform 350 17.8%
Creamar G. Municipal Reform 333 16.9%
Gillett W. Municipal Reform 330 16.7%
Jefferys B. Municipal Reform 326 16.5%
Bolt S. Municipal Reform 321 16.3%
1937 6 5,225 35.3% 1,844
Tingle G. Labour 1,269 68.8%
Groves K. Labour 1,207 65.4%
Webb H. Labour 1,178 63.9%
Green D. Labour 1,177 63.8%
Heward E. Labour 1,152 62.5%
Snowdon J. Labour 1,013 54.9%
Horwood G. ILC 571 31.0%
Wright J. ILC 517 28.0%
Bolt S. Conservative 324 17.6%
Berry A. Conservative 324 17.6%
Mahoney D. Conservative 318 17.2%
1945 6 3,622 30.4% 1,101
Tingle G. Labour 867 78.7%
Freestone G. Labour 851 77.3%
Snowden J. Labour 843 76.6%
Kemp A. Labour 842 76.5%
Scales A. Labour 810 73.6%
Phelby J. Labour 803 72.9%
Patrick L. Communist 305 27.7%
Jeffreys A. IMP 219 19.9%
Wainwright C. IMP 188 17.1%
Blore G. IMP 156 14.2%
1949 6 4,096 31.3% 1,282
Kemp A. Labour 1,150 89.7%
Nicklin W. Labour 1,149 89.6%
Thornton H. Labour 1,148 89.5%
Mahoney J. Labour 1,136 88.6%
Tingle G. Labour 1,128 88.0%
Freestone G. Labour 993 77.5%
Sawyer C. Communist 135 10.5%
Sneddon A. Communist 110 8.6%
|
|
|
|
Post by rightleaning on Aug 5, 2018 8:52:31 GMT
Bermondsey No 3
1900 6 2,604 49.6% 1,292
Dumphreys J. Moderate 728 56.4%
Layman A. Moderate 671 52.0%
Pridmore F. Progressive 628 48.6%
Hole J. Moderate 618 47.8%
Burtwell H. Moderate 609 47.2%
Hollings J. Progressive 597 46.2%
Leeson T. Moderate 596 46.1%
Mitcham G. Moderate 595 46.1%
Shearring W. Progressive 561 43.4%
Rodgers H. Progressive 559 43.3%
Pattenden W. Progressive 551 42.7%
Pierce J. Progressive 527 40.8%
1903 6 2,596 56.4% 1,464
Lattimer T. Progressive 727 49.7%
Pridmore F. Progressive 671 45.8%
Shearring W. Progressive 639 43.6%
Layman A. Moderate 632 43.2%
Ainsworth J. Moderate 619 42.3%
Ings P. Moderate 611 41.7%
Burtwell H. Moderate 600 41.0%
Hole J. Moderate 596 40.7%
McQuire J. Progressive 589 40.2%
Pierce J. Progressive 577 39.4%
Ramsay J. Progressive 574 39.2%
Truman F. Moderate 502 34.3%
Osborn G. Independent 274 18.7%
Plummer J. Independent 209 14.3%
1906 6 3,363 44.3% 1,490
Dumphreys J. Municipal Reform 710 47.7%
Layman A. Municipal Reform 667 44.8%
Shearring W. Progressive 646 43.4%
Pridmore F. Progressive 636 42.7%
Gardiner H. Progressive 636 42.7%
Ings P. Municipal Reform 604 40.5%
Drury W. Municipal Reform 594 39.9%
MacQuire J. Progressive 592 39.7%
Hinton H. Municipal Reform 592 39.7%
Pierce J. Progressive 591 39.7%
Brisbane W. Progressive 589 39.5%
Roxbury W. Municipal Reform 527 35.4%
Osborne G. R.A 283 19.0%
Cooper C. R.A 241 16.2%
Law W. R.A 201 13.5%
1909 6 3,338 52.7% 1,759
Pridmore F. Progressive 883 50.2%
Shearring W. Progressive 870 49.5%
MacGuire J. Progressive 849 48.3%
Dumphreys J. Municipal Reform 809 46.0%
O'Connor M. Progressive 803 45.6%
Layman A. Municipal Reform 779 44.3%
Peeke G. Municipal Reform 770 43.8%
Gaunt A. Municipal Reform 759 43.1%
Roxbury W. Municipal Reform 730 41.5%
Russell C. Municipal Reform 691 39.3%
Ammon C. Labour 591 33.6%
Buzzacott F. Labour 590 33.5%
1912 6 2,818 54.8% 1,544
Dumphreys J. Municipal Reform 744 48.2%
Layman A. Municipal Reform 692 44.8%
Gaunt A. Municipal Reform 663 42.9%
Roxbury W. Municipal Reform 652 42.2%
Ratley D. Municipal Reform 652 42.2%
Morris G. Municipal Reform 631 40.9%
Shearring W. Progressive 627 40.6%
Pridmore F. Progressive 626 40.5%
McGuire J. Progressive 565 36.6%
Collins G. Progressive 556 36.0%
O'Connor M. Progressive 547 35.4%
Whitlam R. Progressive 521 33.7%
Ammon C. Labour 271 17.5%
Gledhill J. Labour 238 15.4%
Fletcher H. Labour 221 14.3%
Chalice J. Labour 214 13.9%
Cragie W. Labour 210 13.6%
Gillian A. Labour 196 12.7%
1919 6 6,390 33.8% 2,160
Gledhill E. Labour 833 38.6%
Shearring W. Independent 799 37.0%
Foster A. Labour 795 36.8%
Doyle F. Labour 788 36.5%
Splash J. Labour 774 35.8%
Coursey T. Labour 760 35.2%
Groves K. Labour 746 34.5%
Pomeroy T. Progressive 670 31.0%
Jeffries A. Progressive 669 31.0%
Pridmore F. Progressive 624 28.9%
MacQuire A. Progressive 525 24.3%
Farris C. Progressive 523 24.2%
Smith T. Progressive 506 23.4%
Layman A. Municipal Reform 410 19.0%
Morris G. Municipal Reform 372 17.2%
Turner G. Municipal Reform 370 17.1%
Wake W. Municipal Reform 340 15.7%
James T. Municipal Reform 321 14.9%
Roxbury W. Municipal Reform 314 14.5%
1922 6 6,679 39.0% 2,605
Gledhill J. Labour 1,208 46.4%
Kidd A. Labour 1,135 43.6%
Spark J. Labour 1,126 43.2%
Langley J. Labour 1,116 42.8%
Coursey T. Labour 1,077 41.3%
Thorpe L. Labour 1,060 40.7%
Courtney W. P.R 967 37.1%
Shearring W. P.R 963 37.0%
Morris G. P.R 848 32.6%
Roxbury W. P.R 799 30.7%
Patrick A. P.R 785 30.1%
Stroud W. P.R 784 30.1%
Parris C. Progressive 496 19.0%
Wright K. Progressive 488 18.7%
Richards J. Progressive 473 18.2%
Jepson J. Progressive 469 18.0%
Goode T. Progressive 465 17.9%
Yates W. Progressive 433 16.6%
1925 6 6,846 47.6% 3,259
Howard W. Labour 1,899 58.3%
Kidd A. Labour 1,855 56.9%
Langley J. Labour 1,843 56.6%
Martin F. Labour 1,826 56.0%
Meadows A. Labour 1,811 55.6%
Powell F. Labour 1,802 55.3%
Shearring W. E.A 1,409 43.2%
Campbell E. E.A 1,404 43.1%
Gilham G. E.A 1,367 41.9%
Harradine J. E.A 1,364 41.9%
Jamieson T. E.A 1,351 41.5%
Westgate G. E.A 1,302 40.0%
1928 6 6,737 36.5% 2,459
Howard W. Labour 1,382 56.2%
Kidd A. Labour 1,378 56.0%
Langley J. Labour 1,339 54.5%
Meadows A. Labour 1,310 53.3%
Powell F. Labour 1,294 52.6%
Webb M. Labour 1,285 52.3%
Campbell E. E.A 1,110 45.1%
Shearring W. E.A 1,043 42.4%
Ibbett I. E.A 1,019 41.4%
Lake E. E.A 985 40.1%
Warwick F. E.A 983 40.0%
Stroud W. E.A 941 38.3%
1931 6 7,203 40.6% 2,924
Glasson E. Labour 1,525 52.1%
Fairbairn W. Labour 1,493 51.1%
Kidd A. Labour 1,484 50.7%
Hatcher A. Labour 1,483 50.7%
Powell F. Labour 1,455 49.8%
White L. Labour 1,439 49.2%
Hamlin W. E.A 1,253 42.8%
Hardy E. E.A 1,246 42.6%
Davey J. E.A 1,242 42.5%
Jamieson T. E.A 1,237 42.3%
Smith H. E.A 1,213 41.5%
Roxbury W. E.A 1,205 41.2%
Farncombe A. Communist 205 7.0%
Merrells H. Communist 130 4.4%
Merrells D. Communist 120 4.1%
Kelleher P. Communist 119 4.1%
Lane F. Communist 117 4.0%
Tippett A. Communist 115 3.9%
1934 6 6,934 37.6% 2,607
Fielder F. Labour 1,886 72.3%
Glasson E. Labour 1,885 72.3%
Glasson L. Labour 1,872 71.8%
Hatcher A. Labour 1,859 71.3%
Kidd A. Labour 1,844 70.7%
Powell F. Labour 1,812 69.5%
Campbell E. Municipal Reform 690 26.5%
Boutcher T. Municipal Reform 688 26.4%
Jefferys A. Municipal Reform 647 24.8%
Hamlin W. Municipal Reform 633 24.3%
Padmore H. Municipal Reform 631 24.2%
Smith H. Municipal Reform 588 22.6%
1937 6 6,582 35.2% 2,317
Cushing M. Labour 1,506 65.0%
Fielder F. Labour 1,503 64.9%
Kidd A. Labour 1,502 64.8%
Glasson E. Labour 1,498 64.7%
Glasson L. Labour 1,494 64.5%
Powell F. Labour 1,454 62.8%
Campbell E. Conservative 609 26.3%
Bottomley A. Conservative 602 26.0%
Figg W. Conservative 589 25.4%
Boutcher T. Conservative 589 25.4%
Hathaway E. Conservative 557 24.0%
Hamlin W. Conservative 506 21.8%
Fowler A. AIPS 194 8.4%
Kavavagh W. AIPS 174 7.5%
1945 6 5,396 23.2% 1,252
Coe A. Labour 1,020 81.5%
Greenwood E. Labour 1,015 81.1%
Snowdon E. Labour 1,010 80.7%
Cushing M. Labour 1,006 80.4%
Hatcher A. Labour 996 79.6%
Powell F. Labour 992 79.2%
Pemberton W. IMP 262 20.9%
Butler J. IMP 232 18.5%
Watson E. IMP 201 16.1%
1949 6 6,353 0.0% 0
Whitnal F. Labour 0 0.0%
Snowdon E. Labour 0 0.0%
Powell F. Labour 0 0.0%
Loveland M. Labour 0 0.0%
Greenwood E. Labour 0 0.0%
Hatcher A. Labour 0 0.0%
|
|
|
|
Post by rightleaning on Aug 5, 2018 8:56:02 GMT
Bermondsey No 4
1900 6 2,613 49.0% 1,280
Cox T. Moderate 612 47.8%
Gardiner H. Progressive 582 45.5%
Martin J. Progressive 554 43.3%
Tovey E. Progressive 554 43.3%
Maxwell W. Moderate 543 42.4%
Williams D. Progressive 543 42.4%
Stebbins G. Progressive 540 42.2%
Stobart W. Independent 531 41.5%
Soutter F. Progressive 524 40.9%
Higgins G. Moderate 519 40.5%
Roxbury W. Moderate 495 38.7%
Wilkinson J. Moderate 492 38.4%
Stephens J. Moderate 477 37.3%
1903 6 2,634 58.4% 1,538
Delderfield W. Progressive 756 49.1%
Tovey E. Progressive 734 47.7%
Gardiner H. Progressive 719 46.7%
Williams D. Progressive 708 46.0%
Martin J. Progressive 691 44.9%
Coulthard E. Independent 670 43.6%
Perry C. Progressive 663 43.1%
Cox T. Moderate 640 41.6%
Jones J. Moderate 547 35.6%
Wilkinson J. Moderate 531 34.5%
Bristow W. Moderate 519 33.7%
Roxbury W. Moderate 459 29.8%
Price H. Moderate 415 27.0%
1906 6 3,357 47.3% 1,588
Delderfield W. Progressive 817 51.5%
Gardiner H. Progressive 792 49.9%
Hood W. Municipal Reform 790 49.8%
Williams D. Progressive 771 48.6%
Tovey E. Progressive 770 48.5%
Martin J. Progressive 752 47.4%
Storey C. Municipal Reform 717 45.2%
Saunders W. Municipal Reform 712 44.8%
Varney A. Progressive 710 44.7%
Voller J. Municipal Reform 706 44.5%
Mitchell G. Municipal Reform 694 43.7%
Antill E. Municipal Reform 629 39.6%
1909 6 3,348 53.0% 1,774
Delderfield W. Progressive 925 52.1%
Gardiner H. Progressive 902 50.8%
Martin J. Progressive 888 50.0%
Williams D. Progressive 862 48.6%
Tovey E. Progressive 847 47.7%
Hood W. Municipal Reform 815 45.9%
Lacey R. Municipal Reform 733 41.3%
Olivier H. Municipal Reform 706 39.8%
Balleine G. Labour 703 39.6%
Morris J. Municipal Reform 697 39.3%
Sadgrove F. Municipal Reform 694 39.1%
Stewart D. Municipal Reform 658 37.1%
1912 6 2,683 57.9% 1,553
Hood W. Municipal Reform 667 42.9%
Earthrowl J. Municipal Reform 636 40.9%
Angle S. Municipal Reform 633 40.7%
Delderfield W. Progressive 624 40.2%
Elliston G. Municipal Reform 605 38.9%
Gerken S. Municipal Reform 579 37.3%
Till C. Municipal Reform 566 36.4%
Williams D. Progressive 564 36.3%
Gardiner H. Progressive 557 35.9%
Tovey E. Progressive 520 33.5%
Archer C. Progressive 511 32.9%
Martin J. Progressive 492 31.7%
Salter A. Labour 476 30.6%
Balliene G. Labour 392 25.2%
Bambury F. Labour 276 17.8%
Dennett F. Labour 267 17.2%
Evans H. Labour 265 17.1%
Smith W. Labour 259 16.7%
1919 6 6,519 38.2% 2,490
Salter A. Labour 1,232 49.5%
Cragie W. Labour 1,214 48.7%
Dennett F. Labour 1,133 45.5%
Langton F. Labour 1,123 45.1%
Weightman S. Labour 1,109 44.5%
Leiver H. Labour 1,046 42.0%
Fisher T. Progressive 916 36.8%
Hobbs P. Progressive 894 35.9%
Gellard G. Progressive 828 33.2%
Mogridge F. Progressive 775 31.1%
Pearson E. Progressive 768 30.8%
Springate A. Progressive 747 30.0%
Loveland G. Municipal Reform 318 12.8%
Midwinter E. Municipal Reform 318 12.8%
Angle S. Municipal Reform 311 12.5%
Thurston M. Municipal Reform 304 12.2%
Hooper E. Municipal Reform 302 12.1%
Bunnage E. Municipal Reform 275 11.0%
1922 6 6,783 39.7% 2,693
Salter A. Labour 1,336 49.6%
Cragie W. Labour 1,312 48.7%
Weightman S. Labour 1,254 46.6%
Dennett F. Labour 1,250 46.4%
Catchpole G. Labour 1,250 46.4%
Nix M. Labour 1,207 44.8%
Shearring W. P.R 841 31.2%
Loveland H. P.R 777 28.9%
Jamieson T. P.R 765 28.4%
Brock S. P.R 762 28.3%
Lake E. P.R 759 28.2%
Hall E. P.R 751 27.9%
Veale J. Progressive 530 19.7%
George H. Progressive 518 19.2%
Bryan J. Progressive 513 19.1%
Horner W. Progressive 496 18.4%
Snook F. Progressive 488 18.1%
Price W. Progressive 487 18.1%
1925 6 7,092 51.5% 3,652
Salter A. Labour 2,186 59.9%
Cragie W. Labour 2,162 59.2%
Weightman S. Labour 2,094 57.3%
Catchpole G. Labour 2,070 56.7%
Vix M. Labour 2,029 55.6%
Cockett W. Labour 2,026 55.5%
Shearring W. E.A 1,401 38.4%
Beningfield A. E.A 1,382 37.8%
Skilleter F. E.A 1,369 37.5%
Brant J. E.A 1,351 37.0%
Farris C. E.A 1,348 36.9%
Beard J. E.A 1,323 36.2%
1928 6 6,932 40.2% 2,787
Salter A. Labour 1,720 61.7%
Cragie W. Labour 1,675 60.1%
Weightman S. Labour 1,587 56.9%
Cockett W. Labour 1,546 55.5%
Husk F. Labour 1,532 55.0%
Nix M. Labour 1,529 54.9%
Bolitho H. E.A 1,108 39.8%
Andrews C. E.A 1,040 37.3%
Farris C. E.A 988 35.5%
Thornton L. E.A 973 34.9%
Martin J. E.A 965 34.6%
Skipper F. E.A 923 33.1%
1931 6 7,418 44.7% 3,316
Salter A. Labour 1,851 55.8%
Cragie W. Labour 1,803 54.4%
Cockett W. Labour 1,767 53.3%
Weightman S. Labour 1,746 52.7%
Husk F. Labour 1,716 51.8%
Nix M. Labour 1,714 51.7%
Hardy H. E.A 1,414 42.6%
Rouse R. E.A 1,410 42.5%
Campbell F. E.A 1,408 42.5%
Bray O. E.A 1,400 42.2%
Thackery F. E.A 1,393 42.0%
Westgate G. E.A 1,375 41.5%
1934 6 7,151 39.7% 2,839
Salter A. Labour 2,173 76.5%
Nix S. Labour 2,061 72.6%
Weightman S. Labour 2,054 72.4%
Cockett W. Labour 2,023 71.3%
Husk F. Labour 2,005 70.6%
Pitt A. Labour 1,957 68.9%
Fitt E. Municipal Reform 715 25.2%
Jamieson T. Municipal Reform 677 23.8%
Nicklin E. Municipal Reform 674 23.7%
Hardy E. Municipal Reform 645 22.7%
Campbell F. Municipal Reform 645 22.7%
Dawson W. Municipal Reform 636 22.4%
1937 6 6,873 35.6% 2,447
Salter A. Labour 1,800 73.6%
Weightman S. Labour 1,726 70.5%
Jaques J. Labour 1,670 68.3%
Hankins W. Labour 1,651 67.5%
MIller W. Labour 1,634 66.8%
Condon I. Labour 1,617 66.1%
Wright F. Conservative 708 28.9%
Brookes T. Conservative 586 23.9%
Cox-Clarke S. Conservative 572 23.4%
Ball F. Conservative 561 22.9%
Budgen E. Conservative 552 22.6%
Caney M. Conservative 545 22.3%
1945 6 4,608 28.9% 1,332
McCleod F. Labour 1,001 75.2%
Melvin F. Labour 996 74.8%
Causton W. Labour 991 74.4%
Melvin E. Labour 986 74.0%
Saunders E. Labour 968 72.7%
Flint F. Labour 942 70.7%
Finn E. Liberal 285 21.4%
Morriss P. Liberal 272 20.4%
Allchurch F. Liberal 260 19.5%
Clapton W. IMP 203 15.2%
Carden W. IMP 200 15.0%
Cox H. IMP 181 13.6%
1949 6 5,679 32.8% 1,863
McCleod F. Labour 1,335 71.7%
Melvin E. Labour 1,329 71.3%
Melvin F. Labour 1,326 71.2%
Flint F. Labour 1,320 70.9%
George L. Labour 1,309 70.3%
Weightman S. Labour 1,209 64.9%
Chapman A. Conservative 354 19.0%
Campbell E. Conservative 351 18.8%
Boyce H. Conservative 340 18.3%
Coombes L. Conservative 336 18.0%
Marlow C. Conservative 327 17.6%
Hacker W. Conservative 327 17.6%
Wainwright C. Liberal 279 15.0%
Bridger G. Liberal 183 9.8%
Jefferies A. Liberal 176 9.4%
O'Keefe G. Liberal 161 8.6%
Cox H. Liberal 159 8.5%
Allchurch F. Liberal 149 8.0%
|
|
|
|
Post by rightleaning on Aug 5, 2018 9:03:13 GMT
Bermondsey No 5
1900 3 1,786 47.9% 855
Hart J. Moderate 452 52.8%
Farmer D. Moderate 437 51.1%
Tyler W. Moderate 435 50.8%
MacNamara J. Progressive 406 47.5%
Stevenson W. Progressive 375 43.8%
Bowes W. Progressive 372 43.5%
1903 3 1,824 56.0% 1,021
Salter A. Progressive 565 55.3%
Stevenson W. Progressive 492 48.2%
Hart J. Moderate 485 47.5%
Benson E. Progressive 482 47.2%
Blake W. Moderate 441 43.2%
Farmer D. Moderate 440 43.1%
1906 3 2,484 48.6% 1,207
Hart J. Municipal Reform 620 51.4%
Dhonau J. Progressive 588 48.7%
Blake W. Municipal Reform 580 48.0%
Spicer E. Progressive 558 46.2%
Haynes A. Municipal Reform 524 43.4%
Wills J. Progressive 511 42.3%
1909 3 2,298 54.9% 1,262
Dhonau J. Progressive 646 51.2%
Hart J. Municipal Reform 618 49.0%
Salter A. Labour 606 48.0%
Beamon W. Labour 595 47.2%
Newell J. Municipal Reform 543 43.0%
Tyler W. Municipal Reform 526 41.7%
1912 3 1,887 59.8% 1,128
Hart J. Municipal Reform 521 46.2%
Gardiner A. Municipal Reform 478 42.4%
Gladwell-Newell J. Municipal Reform 469 41.6%
Salter A. Labour 335 29.7%
Benson F. Progressive 314 27.8%
Dhonau J. Labour 253 22.4%
Stubbs W. Progressive 250 22.2%
Owen H. Progressive 250 22.2%
Parker A. Labour 219 19.4%
Beamon W. I.Soc 98 8.7%
1919 3 4,485 36.5% 1,637
Wills J. Labour 680 41.5%
Parker A. Labour 676 41.3%
White G. Labour 649 39.6%
Laming T. Progressive 515 31.5%
Owen H. Municipal Reform 500 30.5%
Edwards J. Progressive 438 26.8%
Hart J. Municipal Reform 414 25.3%
Oliver E. Progressive 308 18.8%
Cooper F. Municipal Reform 297 18.1%
1922 3 4,820 37.6% 1,812
Owen H. Labour 843 46.5%
Parker A. Labour 804 44.4%
Humphreys F. Labour 768 42.4%
Matthews R. E.A 595 32.8%
Payne P. E.A 465 25.7%
Sheppard W. E.A 451 24.9%
Gladwell-Newell J. Independent 438 24.2%
Cooper F. Independent 274 15.1%
1925 3 4,967 47.0% 2,334
Plummer J. Labour 1,290 55.3%
Parker A. Labour 1,234 52.9%
Henrich M. Labour 1,185 50.8%
Payne P. E.A 993 42.5%
Andrews C. E.A 973 41.7%
Baker E. E.A 964 41.3%
1928 3 4,479 29.4% 1,317
Plummer J. Labour 696 52.9%
Parker A. Labour 680 51.6%
Henrich M. Labour 672 51.0%
Payne K. E.A 594 45.1%
White J. E.A 584 44.3%
Curtis F. E.A 578 43.9%
1931 3 4,837 43.8% 2,119
Reed R. E.A 1,090 51.4%
Wedden R. E.A 1,079 50.9%
Willmott J. E.A 1,074 50.7%
Parker A. Labour 983 46.4%
Henrich M. Labour 973 45.9%
Eyles P. Labour 964 45.5%
1934 3 4,528 42.6% 1,929
Humphreys F. Labour 1,363 70.7%
Butchers R. Labour 1,357 70.3%
Love F. Labour 1,295 67.1%
Butler H. Municipal Reform 554 28.7%
Reed R. Municipal Reform 504 26.1%
Rouse R. Municipal Reform 472 24.5%
1937 3 4,419 40.8% 1,803
Love F. Labour 1,170 64.9%
Humphreys F. Labour 1,167 64.7%
Griffin G. Labour 1,133 62.8%
Hutton V. Conservative 616 34.2%
Butler H. Conservative 578 32.1%
Cooper F. Conservative 577 32.0%
1945 3 4,059 35.4% 1,437
Griffin C. Labour 1,054 73.4%
Humphreys F. Labour 974 67.8%
Jones E. Labour 961 66.9%
Brown W. Communist 375 26.1%
Stevens W. Municipal Reform 232 16.1%
Cooper F. Municipal Reform 219 15.2%
1949 3 4,492 35.5% 1,595
Cheesman A. Labour 1,182 74.1%
Griffin G. Labour 1,180 74.0%
Jacques J. Labour 1,159 72.7%
Borges T. Conservative 312 19.6%
Webb G. Liberal 186 11.7%
Collins J. Liberal 179 11.2%
Whitney A. Liberal 136 8.5%
|
|
|
|
Post by rightleaning on Aug 5, 2018 9:09:44 GMT
Bermondsey No 6
1900 3 1,456 44.4% 646
Manser J. Progressive 356 55.1%
Dean G. Progressive 328 50.7%
Mahoney W. Progressive 313 48.4%
Harbord H. Moderate 296 45.8%
Simpson G. Moderate 264 40.8%
Blake W. Moderate 251 38.8%
1903 3 1,355 47.1% 638
Bustin W. Progressive 401 62.8%
Manser J. Progressive 387 60.6%
Dean G. Progressive 379 59.4%
McCarthy M. P.L 247 38.7%
Mahoney W. P.L 219 34.3%
Driscoll D. P.L 208 32.6%
1906 3 1,815 40.2% 730
Bustin W. Progressive 394 54.0%
Dean G. Progressive 370 50.7%
Trott H. Progressive 363 49.8%
Carroll S. Cath 176 24.1%
McCarthy J. Cath 174 23.8%
Dennithorne J. R.A 172 23.6%
Pearson A. Cath 163 22.3%
Nichol J. R.A 142 19.5%
1909 3 1,606 53.1% 853
Dean G. Progressive 518 60.7%
Bustin W. Progressive 511 59.9%
Lennard A. Progressive 477 55.9%
Foster C. Municipal Reform 337 39.5%
Hence S. Municipal Reform 314 36.8%
Hooton H. Municipal Reform 299 35.1%
1912 3 1,340 46.0% 616
Bustin W. Progressive 359 58.2%
Dean G. Progressive 357 57.9%
Trott H. Progressive 330 53.5%
Buxton W. Municipal Reform 249 40.4%
Sheppard W. Municipal Reform 230 37.3%
Hudson A. Municipal Reform 224 36.3%
1919 3 3,324 33.5% 1,114
Roll J. Labour 519 46.6%
Mulcahy T. Labour 488 43.8%
Norris C. Labour 477 42.8%
Bustin W. Progressive 476 42.7%
Whitlam R. Progressive 441 39.6%
Trott H. Progressive 421 37.8%
Cock W. Municipal Reform 113 10.1%
Hunt W. Municipal Reform 98 8.8%
Sheppard W. Municipal Reform 96 8.6%
1922 3 3,599 37.9% 1,364
Roll J. Labour 956 70.1%
Mulcahy T. Labour 931 68.3%
Wills J. Labour 926 67.9%
Cock W. E.A 354 26.0%
Foster C. E.A 352 25.8%
Halsall R. E.A 321 23.5%
1925 3 3,667 52.2% 1,914
Roll J. Labour 1,063 55.5%
Sweeney D. Labour 1,036 54.1%
Mulcahy T. Labour 995 52.0%
Sheen E. E.A 360 18.8%
Pusey F. E.A 301 15.7%
1928 3 3,390 31.8% 1,078
Sweeney D. Labour 662 61.4%
Roll J. Labour 643 59.6%
Harding C. Labour 539 50.0%
Mulcahy T. Independent 352 32.7%
Hardings A. E.A 229 21.2%
Sweeney E. E.A 192 17.8%
Payne P. E.A 177 16.4%
1931 3 3,594 36.5% 1,312
Roll J. Labour 928 70.7%
Sweeney D. Labour 910 69.4%
Harding C. Labour 877 66.9%
Sweeney E. E.A 372 28.4%
Perrin W. E.A 358 27.3%
Bulwer E. E.A 343 26.1%
1934 3 3,374 0.0% 0
Gibson E. Labour 0 0.0%
Sweeney D. Labour 0 0.0%
Roll J. Labour 0 0.0%
1937 3 3,226 40.0% 1,290
Sweeney D. Labour 1,091 84.5%
Smith A. Labour 1,084 84.0%
Gibson E. Labour 1,081 83.8%
Malton S. Conservative 163 12.6%
Bulwer E. Conservative 152 11.8%
Card B. Conservative 146 11.3%
1945 3 1,691 0.0% 0
Gibson E. Labour 0 0.0%
Coyle J. Labour 0 0.0%
Coyle E. Labour 0 0.0%
1949 3 1,900 0.0% 0
Connelly E. Labour 0 0.0%
Gibson E. Labour 0 0.0%
Adkins A. Labour 0 0.0%
|
|
|
|
Post by rightleaning on Aug 5, 2018 9:16:19 GMT
Rotherhithe No 1
1900 6 2,410 38.8% 935
Talbot F. Moderate 495 52.9%
Wood G. Moderate 477 51.0%
Bulmer J. Moderate 459 49.1%
Hawkins J. Moderate 435 46.5%
Cobon C. Moderate 429 45.9%
Aldridge H. Progressive 417 44.6%
Oakley W. Progressive 392 41.9%
Lambert H. Moderate 374 40.0%
Young H. Progressive 352 37.6%
Walker J. Progressive 312 33.4%
Notcutt G. Progressive 209 22.4%
Portman W. Progressive 183 19.6%
1903 6 2,024 52.2% 1,057
Johns F. Progressive 432 40.9%
Aldridge H. Progressive 430 40.7%
Bartlett H. Progressive 395 37.4%
Collins E. P.L 378 35.8%
Murphy G. Progressive 373 35.3%
Bulmer J. Moderate 338 32.0%
Garland T. Progressive 328 31.0%
Cobon C. Moderate 327 31.0%
Wood G. Moderate 327 31.0%
Burke M. P.L 311 29.4%
Ellis A. Progressive 310 29.3%
Hawkins J. Moderate 305 28.9%
Pink J. Moderate 290 27.4%
Hall G. Moderate 265 25.1%
Cooper E. P.L 215 20.3%
Sullivan J. P.L 206 19.5%
Notcutt G. P.L 197 18.6%
Murray J. P.L 185 17.5%
1906 6 2,507 51.7% 1,296
Johns F. Progressive 595 45.9%
Aldridge H. Progressive 516 39.8%
Richmond B. Progressive 516 39.8%
Foster F. Progressive 484 37.3%
Day J. Municipal Reform 468 36.1%
Bulmer J. Municipal Reform 450 34.7%
Cadman R. Municipal Reform 448 34.6%
Gardiner A. Municipal Reform 416 32.1%
Talbot F. Municipal Reform 413 31.9%
Sturgess E. Progressive 360 27.8%
Barber C. Progressive 347 26.8%
Rye F. Municipal Reform 334 25.8%
Herwig A. R.A 316 24.4%
Harris H. R.A 267 20.6%
Welch J. R.A 233 18.0%
1909 6 2,458 55.3% 1,359
Johns F. Progressive 782 57.5%
Richmond B. Progressive 758 55.8%
Aldridge H. Progressive 736 54.1%
Foster F. Progressive 730 53.7%
Quarrelle J. Progressive 544 40.0%
Bulmer J. Municipal Reform 500 36.8%
Tuckey D. Progressive 496 36.5%
Cadman R. Municipal Reform 494 36.3%
Pink J. Municipal Reform 459 33.8%
Siddle C. Municipal Reform 449 33.0%
Harbord H. Municipal Reform 440 32.4%
Powell A. Municipal Reform 392 28.8%
Hubbard A. S.D 107 7.9%
Sturgess J. S.D 102 7.5%
1912 6 2,202 56.5% 1,244
Richmond B. Progressive 610 49.0%
Foster T. Progressive 578 46.5%
Richmond A. Progressive 575 46.2%
Siddle C. Municipal Reform 559 44.9%
Brown F. Municipal Reform 538 43.2%
Pocock H. Municipal Reform 534 42.9%
Bulmer J. Municipal Reform 518 41.6%
Beech G. Progressive 508 40.8%
Webb T. Municipal Reform 505 40.6%
Ford J. Progressive 492 39.5%
Quarelle J. Progressive 483 38.8%
Groom A. Municipal Reform 449 36.1%
1919 6 4,980 35.3% 1,758
Burgess J. Progressive 991 56.4%
Monk W. Progressive 853 48.5%
Smith R. Progressive 833 47.4%
Foster T. Progressive 757 43.1%
Jones W. Progressive 723 41.1%
Jeffery C. Progressive 666 37.9%
Verrell J. Labour 434 24.7%
Mahoney J. Labour 392 22.3%
Brady J. Labour 365 20.8%
Neville G. Labour 359 20.4%
Siddle C. Municipal Reform 333 18.9%
Pring J. Labour 314 17.9%
Hall A. Labour 301 17.1%
Brown F. Municipal Reform 273 15.5%
Wigginton G. Municipal Reform 229 13.0%
Saunderson W. Municipal Reform 220 12.5%
Matchett W. Municipal Reform 178 10.1%
Dulake W. Municipal Reform 174 9.9%
1922 6 5,278 34.1% 1,800
Burgess J. Labour 1,045 58.1%
Lynch J. Labour 938 52.1%
Llewellyn L. Labour 936 52.0%
Bennett C. Labour 916 50.9%
Plummer J. Labour 896 49.8%
Harrison J. Labour 877 48.7%
Baker N. E.A 727 40.4%
Bulmer J. E.A 660 36.7%
Harris H. E.A 584 32.4%
Squires B. E.A 577 32.1%
Hall J. E.A 577 32.1%
Tansley W. E.A 549 30.5%
1925 6 5,362 41.2% 2,209
Burgess J. Labour 1,306 59.1%
Amos S. Labour 1,224 55.4%
Llewellyn D. Labour 1,222 55.3%
Bennett C. Labour 1,150 52.1%
Newton A. Labour 1,012 45.8%
Loveland G. Labour 994 45.0%
Laming J. E.A 990 44.8%
Edwards R. E.A 877 39.7%
Wallis A. E.A 848 38.4%
McCarthy J. E.A 835 37.8%
Woods E. E.A 788 35.7%
Payne K. E.A 732 33.1%
1928 6 5,315 27.7% 1,472
Amos S. Labour 906 61.5%
Bennett C. Labour 865 58.8%
Loveland G. Labour 847 57.5%
Fortescue A. Labour 843 57.3%
Newton A. Labour 792 53.8%
Roberts E. Labour 767 52.1%
Burgess T. E.A 611 41.5%
Ibbett E. E.A 535 36.3%
Winter R. E.A 519 35.3%
Willmot J. E.A 516 35.0%
Watts A. E.A 498 33.8%
Seymour E. E.A 493 33.5%
1931 6 5,731 40.6% 2,327
Amos S. Labour 1,373 59.0%
Downing A. Labour 1,315 56.5%
Leary A. Labour 1,307 56.2%
Fortescue A. Labour 1,284 55.2%
Roberts E. Labour 1,242 53.4%
Loveland G. Labour 1,242 53.4%
Burgess T. E.A 945 40.6%
Cox J. E.A 918 39.5%
Seymour E. E.A 864 37.1%
Fanning L. E.A 845 36.3%
Wigginton G. E.A 842 36.2%
Malton S. E.A 803 34.5%
1934 6 5,569 42.2% 2,350
Amos C. Labour 1,836 78.1%
Downing A. Labour 1,756 74.7%
Leary A. Labour 1,751 74.5%
Fortescue A. Labour 1,745 74.3%
Loveland G. Labour 1,708 72.7%
Roberts E. Labour 1,683 71.6%
Burgess T. Municipal Reform 543 23.1%
Foster A. Municipal Reform 499 21.2%
Bulwer E. Municipal Reform 465 19.8%
Wigginton G. Municipal Reform 439 18.7%
Hills F. Municipal Reform 435 18.5%
Malton S. Municipal Reform 411 17.5%
1937 6 5,153 44.0% 2,267
Amos S. Labour 1,579 69.6%
Leary A. Labour 1,555 68.6%
Dowling A. Labour 1,526 67.3%
Loveland G. Labour 1,493 65.8%
Stocker W. Labour 1,476 65.1%
Roberts E. Labour 1,463 64.5%
Burgess T. Conservative 672 29.6%
Burrill V. Conservative 645 28.4%
Osmond T. Conservative 629 27.7%
Dyble S. Conservative 616 27.2%
Watson D. Conservative 605 26.7%
Mattingley W. Conservative 576 25.4%
1945 6 4,367 0.0% 0 Lowery M. Labour 0 0.0%
Litchfield F. Labour 0 0.0%
Jaanus S. Labour 0 0.0%
Elliott W. Labour 0 0.0%
Downing D. Labour 0 0.0%
Downing A. Labour 0 0.0%
1949 6 4,842 33.8% 1,637
Downing A. Labour 1,236 75.5%
Goodwin R. Labour 1,226 74.9%
Mahoney M. Labour 1,202 73.4%
Geoghegan P. Labour 1,194 73.0%
Jaanus S. Labour 1,192 72.8%
Mynott W. Labour 1,168 71.4%
Davis E. Conservative 394 24.1%
Robson R. Conservative 379 23.2%
Davis A. Conservative 377 23.0%
|
|
|
|
Post by rightleaning on Aug 5, 2018 9:20:45 GMT
Rotherhithe No 2
1900 6 2,346 41.7% 978
Stuart R. Progressive 559 57.1%
Dugon F. Moderate 469 47.9%
Streeton W. Moderate 468 47.8%
Brown W. Moderate 463 47.3%
Mills W. Moderate 449 45.9%
Smith H. Progressive 429 43.9%
Bellchambers C. Moderate 423 43.2%
Pascoe C. Progressive 404 41.3%
Angus W. Progressive 404 41.3%
Mitchell G. Moderate 324 33.1%
Hickman B. Independent 207 21.2%
1903 6 2,268 49.5% 1,123
Brown J. Progressive 574 51.1%
Dunn K. Progressive 567 50.5%
Lawrence G. Progressive 543 48.4%
Hickman B. Progressive 524 46.7%
Bellsham H. Progressive 511 45.5%
Guerin D. Progressive 507 45.2%
Brown W. Moderate 496 44.2%
Streeton W. Moderate 470 41.9%
Bird G. Moderate 460 41.0%
Harbord H. Moderate 451 40.2%
Cowling T. Moderate 439 39.1%
Walter J. Moderate 405 36.1%
1906 6 3,046 41.5% 1,264
Lee E. Progressive 595 47.1%
Lawrence G. Progressive 532 42.1%
Dunn W. Progressive 500 39.6%
Bird G. Municipal Reform 493 39.0%
Brown J. Progressive 486 38.4%
Morriss H. Municipal Reform 475 37.6%
Bellsham H. Progressive 464 36.7%
Guerin D. Progressive 446 35.3%
Freeman M. Municipal Reform 394 31.2%
White G. Municipal Reform 387 30.6%
Riley H. Municipal Reform 382 30.2%
Selby T. Municipal Reform 376 29.7%
Godden C. R.A 334 26.4%
Starr A. R.A 312 24.7%
Purser A. R.A 281 22.2%
1909 6 2,857 51.3% 1,466
Lawrence G. Progressive 843 57.5%
Brown J. Progressive 828 56.5%
Lee E. Progressive 825 56.3%
Guerin D. Progressive 798 54.4%
Hanson T. Progressive 769 52.5%
Dunn W. Progressive 742 50.6%
Thomas J. Municipal Reform 599 40.9%
Morriss H. Municipal Reform 572 39.0%
Bird G. Municipal Reform 556 37.9%
White G. Municipal Reform 528 36.0%
Steele E. Municipal Reform 503 34.3%
Riley H. Municipal Reform 472 32.2%
1912 6 2,371 51.0% 1,209
Lawrence G. Progressive 629 52.0%
Guerrin D. Progressive 580 48.0%
Lunn C. Municipal Reform 570 47.1%
Kaye-Dunn W. Progressive 569 47.1%
Godden C. Progressive 567 46.9%
Hansom T. Progressive 559 46.2%
Squires B. Municipal Reform 522 43.2%
Mendoza J. Municipal Reform 518 42.8%
Starr A. Progressive 517 42.8%
Williams D. Municipal Reform 487 40.3%
Tungay R. Municipal Reform 479 39.6%
Sanderson W. Municipal Reform 476 39.4%
1919 6 5,760 27.3% 1,572
Lawrence G. Progressive 641 40.8%
Stokes T. Progressive 590 37.5%
Lawrence G. Progressive 580 36.9%
Balman H. Labour 557 35.4%
Baker N. Progressive 554 35.2%
Fox J. Labour 523 33.3%
Saward J. Labour 520 33.1%
Kipps F. Labour 506 32.2%
Gould W. Labour 506 32.2%
Crawford G. Progressive 497 31.6%
Moreton H. Labour 497 31.6%
Basted S. Progressive 465 29.6%
Lunn C. Municipal Reform 280 17.8%
Gregory E. Municipal Reform 265 16.9%
Cole E. Municipal Reform 250 15.9%
Reeve H. Municipal Reform 242 15.4%
Edwards R. Municipal Reform 222 14.1%
Kearley J. Municipal Reform 218 13.9%
1922 6 6,082 33.0% 2,007
Stokes I. Labour 1,156 57.6%
Verrell J. Labour 992 49.4%
Epps J. Labour 977 48.7%
Dye G. Labour 956 47.6%
Lawrence G. Independent 944 47.0%
Saward J. Labour 936 46.6%
Reeve H. Independent 912 45.4%
Fox H. Labour 909 45.3%
Starr A. Independent 885 44.1%
Fitzgerald J. Independent 880 43.8%
Heywood E. Independent 822 41.0%
Morris J. Independent 798 39.8%
1925 6 6,255 45.6% 2,852
Stokes I. Labour 1,750 61.4%
Verrell J. Labour 1,616 56.7%
Starr A. Labour 1,607 56.3%
Wills J. Labour 1,577 55.3%
Wayne J. Labour 1,544 54.1%
Dye G. Labour 1,534 53.8%
Reeve H. Independent 1,109 38.9%
Windmill T. Independent 1,058 37.1%
Painter W. Independent 1,053 36.9%
Gervais A. Independent 1,021 35.8%
Curtis G. Independent 1,021 35.8%
Blanks F. Independent 1,017 35.7%
1928 6 6,064 32.0% 1,940
Stokes I. Labour 1,236 63.7%
Verrell J. Labour 1,218 62.8%
Starr A. Labour 1,184 61.0%
Wayne J. Labour 1,169 60.2%
Bench H. Labour 1,124 57.9%
Henley A. Labour 1,111 57.3%
Reeve H. Independent 706 36.4%
Painter W. Independent 667 34.4%
May J. Independent 665 34.3%
Blanks F. Independent 664 34.2%
Eustace G. Independent 656 33.8%
Nicholson T. Independent 637 32.8%
1931 6 6,473 38.2% 2,473
Starr A. Labour 1,327 53.7%
Wayne J. Labour 1,285 52.0%
Bench H. Labour 1,283 51.9%
Lee C. Labour 1,273 51.5%
Henley A. Labour 1,270 51.4%
Simmonds J. Labour 1,267 51.2%
Lawrence J. E.A 1,126 45.5%
Willmott A. E.A 1,122 45.4%
Bland C. E.A 1,107 44.8%
Scadeng D. E.A 1,097 44.4%
Gardner E. E.A 1,086 43.9%
Martin J. E.A 1,043 42.2%
1934 6 6,262 35.0% 2,192
Starr A. Labour 1,566 71.5%
Henley A. Labour 1,543 70.4%
Beale H. Labour 1,536 70.1%
Lee C. Labour 1,532 69.9%
Simmonds J. Labour 1,513 69.0%
Winch A. Labour 1,479 67.5%
Lawrence J. Municipal Reform 577 26.3%
Willmott J. Municipal Reform 567 25.9%
Willmott A. Municipal Reform 567 25.9%
Dyble S. Municipal Reform 555 25.3%
Nye A. Municipal Reform 542 24.7%
Smith H. Municipal Reform 530 24.2%
1937 6 5,960 33.0% 1,967
Starr A. Labour 1,425 72.5%
Beal H. Labour 1,379 70.1%
Lee C. Labour 1,364 69.4%
Henley A. Labour 1,362 69.2%
Simmonds J. Labour 1,356 68.9%
Winch A. Labour 1,329 67.6%
Lawrence J. Conservative 561 28.5%
Nye A. Conservative 509 25.9%
Winter R. Conservative 498 25.3%
Wyllie H. Conservative 496 25.2%
Stevens W. Conservative 490 24.9%
Tisdell H. Conservative 487 24.8%
1945 6 4,855 33.2% 1,612
Starr A. Labour 1,232 76.4%
Henley M. Labour 1,202 74.6%
Henley P. Labour 1,195 74.1%
Beale H. Labour 1,153 71.5%
Martin A. Labour 1,059 65.7%
Waters E. Labour 1,020 63.3%
Heywood J. Communist 627 38.9%
Burrill V. Municipal Reform 215 13.3%
Brock F. Municipal Reform 211 13.1%
Seymour E. Municipal Reform 190 11.8%
Seymour B. Municipal Reform 182 11.3%
Say W. Municipal Reform 159 9.9%
1949 6 5,787 31.6% 1,829
Henley M. Labour 1,456 79.6%
Culling A. Labour 1,455 79.6%
Starr A. Labour 1,445 79.0%
Martin A. Labour 1,435 78.5%
Jones J. Labour 1,427 78.0%
Sweeney C. Labour 1,419 77.6%
Morris P. Liberal 354 19.4%
Leonard J. Liberal 346 18.9%
Purnell J. Liberal 330 18.0%
Nowlan F. Liberal 326 17.8%
Allchurch F. Liberal 279 15.3%
Black A. Liberal 237 13.0%
|
|
|
|
Post by rightleaning on Aug 5, 2018 9:23:41 GMT
Rotherhithe No 3
1900 3 1,212 46.8% 567
Vezey H. Moderate 400 70.5%
Moss R. Moderate 358 63.1%
Brownfield S. Moderate 355 62.6%
Wilson J. Progressive 162 28.6%
Bellsham H. Progressive 150 26.4%
Purser A. Progressive 139 24.5%
1903 3 1,028 54.5% 560
Vezey H. Moderate 331 59.1%
Marriott W. Moderate 327 58.4%
Moss R. Moderate 274 48.9%
Gorrie W. Progressive 250 44.6%
Smith G. Progressive 202 36.1%
Purser A. Progressive 186 33.2%
1906 3 1,275 56.0% 714
Marriott W. Municipal Reform 399 55.9%
Gorrie W. Progressive 363 50.8%
Vezey H. Municipal Reform 350 49.0%
Saunders G. Municipal Reform 313 43.8%
Garland T. Progressive 274 38.4%
Symonds E. Progressive 251 35.2%
1909 3 1,207 65.7% 793
Marriott W. Municipal Reform 518 65.3%
Vezey H. Municipal Reform 437 55.1%
Saunders G. Municipal Reform 424 53.5%
Gorrie W. Progressive 359 45.3%
Symonds A. Progressive 236 29.8%
Simmonds M. Progressive 224 28.2%
1912 3 1,028 63.7% 655
Marriott W. Municipal Reform 405 61.8%
Vezey H. Municipal Reform 337 51.5%
Saunders G. Municipal Reform 326 49.8%
Harrison J. Progressive 249 38.0%
Lawrence G. Progressive 228 34.8%
Henley A. Progressive 223 34.1%
1919 3 2,500 38.5% 963
Marriott W. Municipal Reform 424 44.1%
Vezey H. Municipal Reform 365 37.9%
Wood R. Progressive 290 30.1%
Easter H. Municipal Reform 289 30.0%
Hansom T. Progressive 277 28.8%
Philpot C. Labour 267 27.7%
Star A. Progressive 255 26.5%
Shute G. Labour 230 23.9%
Howard B. Labour 200 20.8%
1922 3 2,796 40.6% 1,135
Vezey H. E.A 550 48.5%
Philpot C. Labour 523 46.1%
Williams D. Labour 514 45.3%
Shute G. Labour 501 44.1%
Wallis A. E.A 494 43.5%
Wood R. E.A 481 42.4%
1925 3 2,886 58.0% 1,674
Lynch J. Labour 995 59.4%
Philpot C. Labour 887 53.0%
Ranger C. Labour 880 52.6%
Vezey H. E.A 632 37.8%
Campbell R. E.A 609 36.4%
Machell W. E.A 562 33.6%
1928 3 2,844 38.4% 1,092
Lynch J. Labour 691 63.3%
Philpot C. Labour 648 59.3%
Bradley D. Labour 633 58.0%
Moss E. E.A 224 20.5%
Brown E. E.A 208 19.0%
Dowsett C. E.A 207 19.0%
1931 3 3,133 54.5% 1,707
Lynch J. Labour 1,019 59.7%
Bradley D. Labour 976 57.2%
Philpott C. Labour 956 56.0%
Barnes G. E.A 653 38.2%
Nicholson T. E.A 652 38.2%
Cobbold F. E.A 624 36.5%
1934 3 2,997 47.6% 1,427
Lynett J. Labour 1,133 79.4%
Bradley D. Labour 1,093 76.6%
Philpot C. Labour 1,043 73.1%
Humphrey A. Municipal Reform 307 21.5%
Newman P. Municipal Reform 254 17.8%
Murray J. Municipal Reform 248 17.4%
1937 3 2,951 42.9% 1,266
Philpot C. Labour 950 75.0%
Bradley D. Labour 935 73.9%
Ransom G. Labour 858 67.8%
MacKenzie R. Conservative 358 28.3%
Pullar V. Conservative 280 22.1%
Pullar H. Conservative 270 21.3%
1945 3 2,616 0.0% 0
Bond S. Labour 0 0.0%
Simmonds C. Labour 0 0.0%
Bradley D. Labour 0 0.0%
1949 3 3,358 0.0% 0
Simmonds C. Labour 0 0.0%
Connor P. Labour 0 0.0%
Bradley D. Labour 0 0.0%
|
|
|
|
Post by rightleaning on Aug 5, 2018 9:28:08 GMT
St John
1900 3 964 58.5% 564
Bessell W. Moderate 280 49.7%
Wallsgrove G. Progressive 266 47.2%
Bean R. Progressive 262 46.5%
Carbutt F. Moderate 249 44.2%
Gridley C. Moderate 243 43.1%
Cassidy M. Progressive 212 37.6%
Gatter J. I.P 71 12.6%
1903 3 1,000 61.4% 614
Bessell W. Moderate 331 53.9%
Eddis F. Moderate 280 45.6%
Gatter J. Moderate 260 42.3%
Wallsgrove G. P.L 184 30.0%
Packer A. Progressive 137 22.3%
Burgess A. Progressive 135 22.0%
Steers F. Progressive 133 21.7%
Bennett R. P.L 131 21.3%
Peckham J. P.L 127 20.7%
1906 3 1,180 57.7% 681
Bessell W. Municipal Reform 378 55.5%
Eddis F. Municipal Reform 355 52.1%
Gatter J. Municipal Reform 318 46.7%
Wallsgrove G. Progressive 305 44.8%
Hartley J. Progressive 264 38.8%
Sims G. Progressive 241 35.4%
1909 3 1,071 62.0% 664
Potton T. Municipal Reform 383 57.7%
Eddis F. Municipal Reform 362 54.5%
Marwick W. Municipal Reform 345 52.0%
Pollock R. Progressive 286 43.1%
Plummer J. Progressive 272 41.0%
Braben A. Progressive 257 38.7%
1912 3 954 56.4% 538
Potton T. Municipal Reform 276 51.3%
Marwick W. Municipal Reform 263 48.9%
Eddis F. Municipal Reform 249 46.3%
Holland P. Progressive 188 34.9%
Denny J. Progressive 186 34.6%
Rowe G. Progressive 168 31.2%
Williams H. Independent 147 27.3%
1919 3 1,934 42.6% 824
Keenor A. Progressive 578 70.2%
Sullivan J. Progressive 508 61.7%
Denny J. Progressive 503 61.1%
Potton T. Municipal Reform 236 28.6%
Eddis F. Municipal Reform 228 27.7%
Marwick W. Municipal Reform 198 24.0%
1922 3 2,025 44.3% 897
Sullivan J. E.A 595 66.3%
Denby F. E.A 593 66.1%
Thomas D. E.A 582 64.9%
Kipps F. Labour 326 36.3%
Fant F. Labour 319 35.6%
White E. Labour 292 32.6%
1925 3 2,054 50.9% 1,045
Denby F. E.A 614 58.7%
Sullivan J. E.A 608 58.2%
Thomas D. E.A 592 56.6%
Norris C. Labour 431 41.2%
Norman A. Labour 414 39.6%
Tidswell A. Labour 401 38.4%
1928 3 2,107 43.1% 908
Ponsford A. E.A 505 55.6%
Sullivan J. E.A 491 54.1%
Phillips W. E.A 491 54.1%
Gibson E. Labour 387 42.6%
Johnstone W. Labour 383 42.2%
Clark J. Labour 379 41.7%
1931 3 2,203 47.7% 1,051
Ponsford A. E.A 664 63.2%
Sullivan J. E.A 652 62.0%
Phillips W. E.A 651 62.0%
Hunt J. Labour 356 33.9%
Beal H. Labour 353 33.6%
Clark J. Labour 349 33.2%
1934 3 2,094 54.9% 1,150
Kirby J. Labour 728 63.3%
Eyles P. Labour 704 61.2%
Stocker W. Labour 683 59.4%
Ponsford A. E.A 364 31.7%
Phillips W. E.A 350 30.4%
Sullivan J. E.A 341 29.7%
Campbell R. I.RA 71 6.2%
Reeve H. I.RA 65 5.7%
Machell W. I.RA 43 3.7%
1937 3 1,905 53.3% 1,015
Lowery M. Labour 656 64.6%
Eyles P. Labour 656 64.6%
Greenwood E. Labour 650 64.0%
Ponsford A. Conservative 329 32.4%
Sullivan J. Conservative 324 31.9%
Sutch W. Conservative 313 30.8%
1945 3 1,255 53.0% 665
Jones L. Labour 470 70.7%
Thomas J. Labour 428 64.3%
Eyles P. Labour 424 63.7%
Sanders R. Municipal Reform 189 28.4%
1949 3 1,458 55.0% 802
Moriarty D. Labour 546 68.1%
Jones L. Labour 544 67.8%
Elliott W. Labour 544 67.8%
Sanders R. Conservative 257 32.0%
Puddick A. Conservative 249 31.1%
Chenery M. Conservative 241 30.1%
|
|
|
|
Post by rightleaning on Aug 5, 2018 9:33:58 GMT
St Olave
1900 3 415 64.3% 267
Shand A. Independent 118 44.2%
Collins J. Progressive 101 37.8%
Besley E. Independent 95 35.6%
Renwick J. Moderate 85 31.9%
Smith H. Moderate 84 31.5%
Oake J. Independent 82 30.7%
Caeser C. Moderate 72 27.0%
Bennett R. Progressive 69 25.9%
Percy E. Progressive 67 25.1%
1903 3 369 58.5% 216
Fells R. Moderate 155 71.8%
Shand A. Moderate 150 69.5%
Oake J. Moderate 148 68.6%
Partridge G. Progressive 51 23.6%
Symonds E. Progressive 50 23.2%
1906 3 420 42.4% 178
Shand A. Municipal Reform 165 92.7%
Oake J. Municipal Reform 164 92.1%
Fells R. Municipal Reform 163 91.5%
Hunt G. Progressive 37 20.8%
Lee H. Progressive 36 20.2%
Lawrence G. Progressive 35 19.7%
1909 3 347 48.4% 168
Oake J. Municipal Reform 136 81.0%
Fells R. Municipal Reform 129 76.8%
Chapman D. Municipal Reform 126 75.0%
Lawrence G. Progressive 29 17.3%
Hatton H. Progressive 29 17.3%
Rexstraw A. Progressive 24 14.3%
1912 3 339 62.0% 210
Fells A. Municipal Reform 127 60.4%
Oake J. Municipal Reform 104 49.5%
Morris J. Municipal Reform 99 47.1%
Hartley J. Progressive 97 46.2%
Tuckey D. Progressive 85 40.4%
Wiffen W. Progressive 83 39.5%
1919 3 655 54.0% 354
Mallandain W. Progressive 235 66.4%
Elliott W. Progressive 232 65.6%
Ayling T. Progressive 229 64.7%
Fells A. Municipal Reform 132 37.3%
Oake J. Municipal Reform 100 28.3%
Renwick C. Municipal Reform 84 23.7%
1922 3 672 48.8% 328
Mallandain W. E.A 193 58.9%
Phillips W. E.A 184 56.1%
Ayling T. E.A 184 56.1%
Clare G. Labour 133 40.6%
Newton A. Labour 132 40.3%
Verrall H. Labour 128 39.0%
1925 3 684 58.8% 402
Stokes E. Labour 223 55.4%
Fairbairn W. Labour 219 54.5%
Baker A. Labour 218 54.2%
Jones G. E.A 173 43.0%
Phillips A. E.A 162 40.3%
Robertson J. E.A 154 38.3%
1928 3 667 53.7% 358
Stokes E. Labour 222 62.0%
Rowe B. Labour 213 59.5%
Fairbairn W. Labour 185 51.7%
Sharman A. E.A 156 43.6%
Mallandain J. E.A 130 36.3%
Mallandain A. E.A 130 36.3%
1931 3 713 59.2% 422
Stokes E. Labour 262 62.1%
Mahoney J. Labour 256 60.6%
Williams W. Labour 244 57.8%
Davis J. E.A 160 37.9%
Campbell E. E.A 157 37.2%
Bisley C. E.A 155 36.7%
1934 3 604 57.5% 347
Mahoney J. Labour 248 71.4%
Clark J. Labour 246 70.8%
Williams W. Labour 238 68.5%
Smith H. Municipal Reform 90 25.9%
Mallandain A. Municipal Reform 85 24.5%
Edgeley W. Municipal Reform 76 21.9%
Ellmer T. I.RA 17 4.9%
Winter R. I.RA 9 2.6%
Woods S. I.RA 6 1.7%
1937 3 681 52.9% 360
Mahoney J. Labour 287 79.7%
Bartlett T. Labour 279 77.4%
Williams W. Labour 258 71.6%
Edgeley W. Conservative 74 20.5%
Mallandain A. Conservative 66 18.3%
Rouse R. Conservative 59 16.4%
1945 3 673 0.0% 0
Mahoney J. Labour 0 0.0%
Ellis W. Labour 0 0.0%
Adkins A. Labour 0 0.0%
1949 3 824 0.0% 0
Mahoney J. Labour 0 0.0%
Lett F. Labour 0 0.0%
Ellis W. Labour 0 0.0%
|
|
|
|
Post by rightleaning on Aug 5, 2018 9:35:45 GMT
St Thomas
1900 3 518 47.1% 244
Millson H. Moderate 178 73.0%
Goulding F. Moderate 155 63.5%
Fells J. Moderate 150 61.5%
Davies E. Progressive 74 30.3%
Stevens A. Progressive 65 26.6%
Peckham J. Progressive 63 25.8%
1903 3 469 53.5% 251
Goulding F. Moderate 159 63.4%
Fells J. Moderate 159 63.4%
Renwick J. Moderate 154 61.4%
Smith W. Progressive 98 39.1%
Salter A. Progressive 82 32.7%
1906 3 485 49.9% 242
Renwick A. Municipal Reform 211 87.2%
Fells J. Municipal Reform 205 84.7%
Goulding F. Municipal Reform 193 79.7%
Steers F. Progressive 34 14.0%
Smart A. Progressive 30 12.4%
Wakerell W. Progressive 25 10.3%
1909 3 448 41.5% 186
Renwick A. Municipal Reform 154 82.8%
Laird E. Municipal Reform 147 79.1%
Wyatt J. Municipal Reform 145 78.0%
Coleman J. Progressive 34 18.3%
Bradley H. Progressive 34 18.3%
Gilbert R. Progressive 29 15.6%
1912 3 449 48.6% 218
Renwick J. Municipal Reform 143 65.5%
Hooton H. Municipal Reform 130 59.6%
Laird E. Municipal Reform 129 59.1%
O'Brien D. Progressive 83 38.0%
Symonds E. Progressive 72 33.0%
Mortimer E. Progressive 66 30.2%
1919 3 654 34.6% 226
Fant F. Progressive 142 62.8%
Barton G. Progressive 138 61.0%
Plummer J. Progressive 137 60.5%
Bolt W. Municipal Reform 78 34.5%
Page B. Municipal Reform 73 32.3%
Gladwell-Newell J. Municipal Reform 72 31.8%
1922 3 681 50.4% 343
Barton G. E.A 169 49.2%
Renwick C. E.A 160 46.6%
Salisbury W. E.A 149 43.4%
Garaghty T. Independent 129 37.6%
Kirby J. Labour 77 22.4%
Balman H. Labour 68 19.8%
Randle E. Labour 66 19.2%
1925 3 699 55.1% 385
Jagger H. E.A 208 54.0%
Salisbury W. E.A 203 52.7%
Phillips J. E.A 200 51.9%
Geoghegan J. Labour 174 45.2%
Walsh M. Labour 167 43.4%
Aylward A. Labour 167 43.4%
1928 3 682 46.2% 315
Salisbury W. E.A 188 59.7%
Phillips J. E.A 186 59.0%
Jagger H. E.A 183 58.1%
Balman H. Labour 120 38.1%
Leary A. Labour 119 37.8%
Kirby J. Labour 119 37.8%
1931 3 742 44.3% 329
Phillips J. E.A 222 67.5%
Shearring W. E.A 219 66.6%
Salisbury W. E.A 217 66.0%
Foster F. Labour 103 31.3%
McKay W. Labour 101 30.7%
Targett J. Labour 94 28.6%
1934 3 688 63.7% 438
Balman H. Labour 276 63.0%
Fane F. Labour 270 61.6%
Page J. Labour 266 60.7%
Bisley C. E.A 148 33.8%
Phillips J. E.A 142 32.4%
Shearring W. E.A 136 31.0%
Salisbury W. I.RA 15 3.4%
Jordan A. I.RA 12 2.7%
Hay J. I.RA 11 2.5%
1937 3 574 46.7% 268
Balman H. Labour 148 55.2%
Fane F. Labour 141 52.6%
Clark J. Labour 139 51.9%
Phillips J. Conservative 115 42.9%
Phillips W. Conservative 113 42.2%
Smith H. Conservative 110 41.0%
1945 3 198 57.1% 113
Martin A. Municipal Reform 58 51.3%
Figg W. Municipal Reform 56 49.5%
Martin C. Municipal Reform 54 47.8%
Hardy G. Labour 47 41.6%
Parker A. Labour 40 35.4%
Philpot I. Labour 39 34.5%
1949 3 214 65.0% 139
Cater J. Labour 74 53.2%
Neighbour I. Labour 73 52.5%
Irving F. Labour 73 52.5%
Figg W. Conservative 66 47.4%
Martin A. Conservative 63 45.3%
Martin C. Conservative 61 43.9%
|
|
|
|
Post by rightleaning on Aug 5, 2018 9:43:41 GMT
Abbey
1953 4 3,960 0.0% 0
Freestone A. Labour 0 0.0%
Mathews G. Labour 0 0.0%
Kemp A. Labour 0 0.0%
Lacey J. Labour 0 0.0%
1956 4 3,846 24.4% 938
Lacey J. Labour 843 89.8%
Nicklin W. Labour 810 86.3%
Power J. Labour 788 84.0%
Ackland F. Labour 779 83.0%
Patrick L. Communist 118 12.6%
Woodruff A. Communist 65 6.9%
1959 4 3,199 0.0% 0
Ackland F. Labour 0 0.0%
Bristow G. Labour 0 0.0%
Freestone A. Labour 0 0.0%
Lacey J. Labour 0 0.0%
1962 4 3,308 0.0% 0
Watts H. Labour 0 0.0%
Ackland F. Labour 0 0.0%
Lacey J. Labour 0 0.0%
Freestone A. Labour 0 0.0%
|
|
|
|
Post by rightleaning on Aug 5, 2018 9:47:02 GMT
Central
1953 4 3,688 40.9% 1,508
Griffin G. Labour 955 63.3%
Hand C. Labour 935 62.0%
Wardell W. Labour 931 61.7%
Florance F. Labour 880 58.3%
Murray J. Conservative 535 35.5%
Gillison J. Conservative 518 34.3%
1956 4 3,394 24.1% 818
Henley L. Labour 668 81.7%
Hough J. Labour 650 79.5%
Florance F. Labour 647 79.1%
Wardell W. Labour 629 76.9%
Murray J. Conservative 150 18.3%
Simpkins E. Conservative 127 15.5%
1959 4 3,213 24.1% 774
Wardell W. Labour 608 78.5%
Florance F. Labour 604 78.0%
Henley L. Labour 596 77.0%
Mahoney J. Labour 584 75.4%
Brock H. Conservative 176 22.7%
1962 4 3,235 24.9% 806
Florance F. Labour 665 82.6%
Edwards E. Labour 658 81.7%
Nazer E. Labour 629 78.1%
White M. Labour 612 76.0%
Brock H. Conservative 145 18.0%
Reddin F. Conservative 143 17.8%
|
|
|
|
Post by rightleaning on Aug 5, 2018 9:49:18 GMT
Dockyard
1953 3 2,615 0.0% 0
Lloyd B. Labour 0 0.0%
Harden T. Labour 0 0.0%
Brown L. Labour 0 0.0%
1956 3 2,519 0.0% 0
Brown W. Labour 0 0.0%
Riddell E. Labour 0 0.0%
Brent A. Labour 0 0.0%
1959 3 2,404 0.0% 0
Mackay W. Labour 0 0.0%
Brown W. Labour 0 0.0%
Brent A. Labour 0 0.0%
1962 3 2,305 0.0% 0
Conaway A. Labour 0 0.0%
Brown F. Labour 0 0.0%
Brent A. Labour 0 0.0%
|
|
|
|
Post by rightleaning on Aug 5, 2018 9:50:19 GMT
Leathermarket
1953 5 4,385 28.7% 1,258
Hendy T. Labour 1,010 80.3%
Quirk P. Labour 1,009 80.2%
Newbery J. Labour 1,000 79.5%
Eagle T. Labour 1,000 79.5%
Samuels C. Labour 974 77.4%
Simpkins E. Conservative 181 14.4%
1956 5 4,170 0.0% 0
Pearce M. Labour 0 0.0%
Newbery J. Labour 0 0.0%
Hendy T. Labour 0 0.0%
Mackay W. Labour 0 0.0%
Kemp A. Labour 0 0.0%
1959 5 4,003 0.0% 0
Thurkle G. Labour 0 0.0%
Osborn T. Labour 0 0.0%
Kemp A. Labour 0 0.0%
Hendy T. Labour 0 0.0%
Freestone G. Labour 0 0.0%
1962 5 3,531 0.0% 0
Sawyer C. Labour 0 0.0%
Murphy J. Labour 0 0.0%
Lacey M. Labour 0 0.0%
Kemp A. Labour 0 0.0%
Freestone G. Labour 0 0.0%
|
|
|
|
Post by rightleaning on Aug 5, 2018 9:51:13 GMT
Neckinger
1953 3 2,930 0.0% 0
Adkins A. Labour 0 0.0%
Connolly G. Labour 0 0.0%
Coyle E. Labour 0 0.0%
1956 3 2,847 0.0% 0
Thurkle G. Labour 0 0.0%
Shaw M. Labour 0 0.0%
Coyle E. Labour 0 0.0%
1959 3 2,385 0.0% 0
Shaw M. Labour 0 0.0%
Coyle E. Labour 0 0.0%
Brett L. Labour 0 0.0%
1962 3 2,648 0.0% 0
Coyle E. Labour 0 0.0%
Colmy J. Labour 0 0.0%
Brett L. Labour 0 0.0%
|
|
|
|
Post by rightleaning on Aug 5, 2018 9:54:22 GMT
Park
1953 3 2,808 29.1% 817
Culling A. Labour 678 83.0%
Creswick F. Labour 660 80.8%
Freestone G. Labour 628 76.9%
Cain W. Liberal 141 17.3%
Gilbert R. Liberal 126 15.4%
Wrigglesworth A. Liberal 118 14.4%
1956 3 2,571 0.0% 0
Rowe E. Labour 0 0.0%
Mahoney J. Labour 0 0.0%
Creswick F. Labour 0 0.0%
1959 3 2,372 0.0% 0
Rowe E. Labour 0 0.0%
Mahoney J. Labour 0 0.0%
Creswick F. Labour 0 0.0%
1962 3 2,529 0.0% 0
Rowe E. Labour 0 0.0%
Mahoney J. Labour 0 0.0%
Creswick F. Labour 0 0.0%
|
|
|
|
Post by rightleaning on Aug 5, 2018 9:55:37 GMT
Raymouth
1953 3 3,215 30.7% 987
Martin A. Labour 781 79.1%
Mahoney J. Labour 781 79.1%
Harrison W. Labour 710 71.9%
Webb G. Liberal 232 23.5%
Lowe E. Liberal 181 18.3%
Ince H. Liberal 177 17.9%
1956 3 2,858 25.3% 723
Henley M. Labour 578 79.9%
Lee C. Labour 570 78.8%
Martin A. Labour 557 77.0%
Pepler A. Conservative 75 10.4%
Webb G. Liberal 74 10.2%
Lowe E. Liberal 68 9.4%
Barber T. Conservative 68 9.4%
Cox H. Liberal 64 8.9%
1959 3 3,136 24.0% 753
Henley M. Labour 509 67.6%
Henley P. Labour 504 67.0%
Martin A. Labour 500 66.4%
Lowe E. Liberal 146 19.4%
Davies L. Liberal 137 18.2%
Moore H. Liberal 129 17.1%
1962 3 2,554 0.0% 0
Lane F. Labour 0 0.0%
Henley P. Labour 0 0.0%
Henley M. Labour 0 0.0%
|
|
|
|
Post by rightleaning on Aug 5, 2018 9:57:34 GMT
Saints
1953 3 2,790 39.9% 1,113
Ellis W. Labour 826 74.2%
Thomas I. Labour 821 73.8%
Ackland F. Labour 786 70.6%
Puddick A. Conservative 275 24.7%
Bassett C. Conservative 253 22.7%
Chenery M. Conservative 243 21.8%
1956 3 2,682 0.0% 0
Ellis W. Labour 0 0.0%
Stockman W. Labour 0 0.0%
Thomas I. Labour 0 0.0%
1959 3 2,552 0.0% 0
Thomas I. Labour 0 0.0%
Millichope J. Labour 0 0.0%
Foot J. Labour 0 0.0%
1962 3 1,939 35.3% 684
Thomas I. Labour 536 78.3%
Foot J. Labour 524 76.6%
Osborn T. Labour 507 74.1%
Brown J. Conservative 148 21.6%
Morgan F. Conservative 142 20.7%
Colbran G. Conservative 123 18.0%
|
|
|
|
Post by rightleaning on Aug 5, 2018 10:00:05 GMT
South
1953 3 2,717 28.0% 761 Power J. Labour 619 81.4%
Mahoney J. Labour 615 80.8%
Leahy W. Labour 614 80.7%
Coombes L. Conservative 129 17.0%
Chapman A. Conservative 126 16.6%
1956 3 2483 0.0% 0
Roll M. Labour 0 0.0%
Mahoney J. Labour 0 0.0%
Dipple C. Labour 0 0.0%
1959 3 2483 0.0% 0
Roll M. Labour 0 0.0%
Mackay T. Labour 0 0.0%
Creswick S. Labour 0 0.0%
1962 3 2265 0.0% 0
Roll M. Labour 0 0.0%
Ellis W. Labour 0 0.0%
Creswick S. Labour 0 0.0%
|
|
|
|
Post by rightleaning on Aug 5, 2018 10:01:36 GMT
South West
1953 3 3011 0.0% 0
Hatcher A. Labour 0 0.0%
Greenwood E. Labour 0 0.0%
Garnett N. Labour 0 0.0%
1956 3 2871 0.0% 0
Greenwood E. Labour 0 0.0%
Hatcher A. Labour 0 0.0%
Mathews G. Labour 0 0.0%
1959 3 2745 0.0% 0
Nicklin W. Labour 0 0.0%
Hatcher A. Labour 0 0.0%
George L. Labour 0 0.0%
1962 3 2544 0.0% 0
Nicklin W. Labour 0 0.0%
Henley L. Labour 0 0.0%
Hatcher A. Labour 0 0.0%
|
|
|
|
Post by rightleaning on Aug 5, 2018 10:05:54 GMT
Thorburn
1953 3 2,758 30.7% 847
George L. Labour 625 73.8%
Weightman S. Labour 607 71.7%
McLeod F. Labour 602 71.1%
Cross F. Conservative 225 26.6%
Cox H. Conservative 195 23.0%
Morgan C. Conservative 188 22.2%
1956 3 2,538 23.5% 596
Melvin F. Labour 428 71.8%
McLeod F. Labour 427 71.6%
George L. Labour 408 68.4%
Wright F. Conservative 157 26.3%
Coombes L. Conservative 143 24.0%
1959 3 2,579 26.3% 678
McLeod F. Labour 512 75.5%
Curtis E. Labour 496 73.1%
Melvin F. Labour 493 72.7%
Abel D. Conservative 169 24.9%
Coombes L. Conservative 164 24.2%
1962 3 2,443 27.7% 677
Curtis E. Labour 553 81.7%
McLeod F. Labour 547 80.8%
Melvin F. Labour 547 80.8%
Wright F. Conservative 109 16.1%
Hearne V. Conservative 107 15.8%
Coombes L. Conservative 106 15.7%
|
|
|
|
Post by rightleaning on Aug 5, 2018 10:06:23 GMT
Tunnel
1953 5 4,686 27.2% 1,275
Gillard G. Labour 829 65.0%
Murphy J. Labour 817 64.1%
Mynott W. Labour 806 63.2%
Manning E. Labour 781 61.3%
Geoghegan P. Labour 740 58.1%
Stewart N. Independent 469 36.8%
1956 5 4,808 21.7% 1,043
Gillard G. Labour 665 63.7%
Brown L. Labour 662 63.5%
Geoghegan P. Labour 651 62.4%
Tindall G. Labour 622 59.6%
Torrison A. Labour 581 55.7%
Hodkinson J. Conservative 367 35.2%
1959 5 4,249 21.1% 897
Brown L. Labour 548 61.1%
O'Grady J. Labour 531 59.2%
Pinchbeck G. Labour 529 59.0%
Tindall G. Labour 519 57.9%
Torrison A. Labour 466 52.0%
Hayward C. Conservative 285 31.8%
1962 5 3,977 28.9% 1,149
Cheesman A. Labour 949 82.6%
Brown L. Labour 935 81.4%
O'Grady J. Labour 920 80.0%
Pinchbeck G. Labour 906 78.8%
Tindall G. Labour 883 76.8%
Hayward C. Conservative 204 17.7%
Davis G. Conservative 187 16.3%
|
|
|
|
Post by rightleaning on Aug 5, 2018 10:07:14 GMT
Willow Walk
1953 3 3,030 23.3% 706
Nicklin W. Labour 589 83.4%
Foot J. Labour 584 82.7%
Shaw T. Labour 551 78.0%
Phillips W. Liberal 125 17.7%
Browne T. Liberal 122 17.3%
1956 3 2,977 0.0% 0
Whitnall F. Labour 0 0.0%
Shaw T. Labour 0 0.0%
Foot J. Labour 0 0.0%
1959 3 2,851 0.0% 0
Whitnall F. Labour 0 0.0%
Nicklin G. Labour 0 0.0%
Garnett N. Labour 0 0.0%
1962 3 2,762 0.0% 0
Whitnall F. Labour 0 0.0%
Nicklin G. Labour 0 0.0%
Collins T. Labour 0 0.0%
|
|
colinjg
Member
Living in the Past
Posts: 269
|
Post by colinjg on Nov 1, 2020 15:18:15 GMT
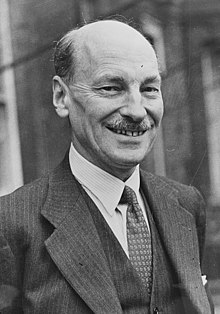
No collection of results for Bermondsey Metropolitan Borough Council should pass without mentioning the huge influence of Dr Alfred and Mrs Ada Salter in the borough’s politics. Fenner Brockway in his book, Bermondsey Story (George Allen and Unwin, 1949) paints an affectionate picture of a remarkable man who stuck to his Christian Socialist and pacifist principles to the end of his life. In 1928 Bermondsey Labour Party published a significant 40-page manifesto, Six Years of Labour Rule, the cover of which I reproduce below. Unfortunately it has become very fragile and I am therefore prevented from making further scans for inclusion in the forum. By dipping into both publications I can add a little colour to the election results reproduced above. 1903: Dr Alfred Salter topped the poll in no. 5 ward with 565 votes. He stood on the Progressive slate. 1906: Salter was an unsuccessful candidate in no. 2 ward, but was returned to the LCC as a Progressive the following year for the Southwark, Bermondsey division. 1909: Mrs Ada Salter was the only successful candidate for Labour with 606 votes in the 3-member no. 5 ward (the Progressives only nominated one candidate). Because of the format of the results in the posts above, it isn’t particularly clear that this was Ada, not Alfred. Brockway states that Ada was the first woman councillor to be elected to a London borough council. 1910: Alfred lost his LCC seat after leaving the Progressives. He stood as an ILP candidate. 1912: Ada lost her council seat, in fourth place in no. 5 ward, securing only 335 votes. 1919: Ada was re-elected to the council for no. 4 ward, receiving the highest number of votes (1,232) of any candidate in the borough. A total of 24 Labour councillors were elected out of a council membership of 54 councillors and 9 aldermen. Dr Salter was appointed one of two Labour aldermen. During the course of the 1919-22 cycle, three more Labour candidates gained seats at by-elections to bring the Labour strength up to 29. The clear rise of Labour in the borough forced the Liberals and Conservatives into a coalition (if not in name). 1922: Labour secured a majority, with 38 councillors elected. With aldermen, their strength is 42. Ada Salter is appointed Mayor; she declined to wear the Mayoral robes or the chain of office. At that year’s General Election Alfred Salter is elected MP for West Bermondsey, a position he held until 1945, the year of his death. 1925: There are now 48 Labour councillors, rising to 56 with aldermen. Only 7 anti-socialists sit on the council.  |
|
colinjg
Member
Living in the Past
Posts: 269
|
Post by colinjg on Nov 11, 2020 16:09:13 GMT
Following on from my posts about Bermondsey, forum member David J. Glanfield got in touch to alert me to a bookshop selling 12 Years of Labour Rule on the Bermondsey Borough Council 1922-1934: Labour's Magnificent Record. This has been purchased and perused. Similar in format to the manifesto of six years earlier, the 1934 version is longer (64 pages) and more confident in tone. The foreword was written by Dr. Salter: he reported that after the 1931 elections there were 45 Labour councillors and 9 for the opposition. This represented a loss of 3 compared to 1928, and a quick check of Willis and Woollard's publications show this was due to the narrow loss of the 3-member Bermondsey No. 5 ward. After 1931, Salter tells us that by-elections reduced the number of anti-Labour councillors by one. A look at the 1934 results shows that Labour's confidence was justified: all seats in all wards were taken with gains in Bermondsey No. 5, St. John, and St. Thomas wards. The first image below reproduces the cover of the manifesto with its snazzy art deco typeface. The drawing is of the Central Library, Town Hall and Municipal Offices. The second illustration is a compilation of snapshots of the 'old' and 'new' Bermondsey, highlighting slum clearance and new housing schemes. The third and final illustration shows a picture of the Labour leader of the Council, William J. Cragie. He had led the council group since 1922. At the 1931 election he was returned as a councillor for Bermondsey No. 4 ward, but is not to be found in the 1934 results; presumably he continued onto the aldermanic bench. This last image also has a classic printing error: C. Bennett & Co. were no doubt cross that their advert was upside down!    |
|